Measuring Corruption with Big Data
ACREC Lecture
Vilnius University
2026-01-24
Big Data and Anti-Corruption
What is Big Data?
Why Big Data?:
- Higher processing power is now available (e.g. AI)
- More data available (internet of things)
- Greater need for classification and prediction
Characteristics of Big Data:
- High Frequency (refresh rate)
- High Level of Detail (granularity)
- High Coverage (scope)
- High Availability (access)
Traditional (survey) vs Big data
| Surveys | Big Data | |
|---|---|---|
| Observations | Sample (n) | Entire Population (N) |
| Sources | Single questionnaire | Multiple sources |
| Data collection | Structured interviews (humans) | Algorithms (computers) |
| Data type | Subjective (self-reflective) | Objective (behavioral) |
| Data generation | Controlled (for evaluation) | Heterogeneous (for other purposes) |
| Data analysis | Traditional statistics | Traditional statistics and machine learning |
| Validity | Sampling error | Predictive power |
Source: “Introduction to Big Data for Social Science Research” (2019)
Challenges of Big Data
Big Data is often generated for a purpose other than research or evaluation. Therefore it suffers from:
- Varying standards of validity and reliability
- Unstructured data formats
- Lack of documentation
- Constant changes
- Ethical issues (privacy)
Structuring (wrangling) Big Data
The cost of collecting data has dropped dramatically. However, there is still a high cost in structuring big datasets.
Often, we will find data in a very messy format, this requires us to clean and organize it.
This may include manual verification, cross-data-set comparisons, statistical testing, and data engineering.
Analyzing Big Data
We can (and should) use a combination of both traditional statistics an machine learning approaches.
Examples
- Legislative texts
- Social media posts
- Financial flows
- Public contracts
Methods
- Supervised: we solve for \(f\) in \(y=f(x)\)
- Unsupervised: we look for patterns in \(x\)
- Semi-supervised: the model classifies into given parameters
Big Data and Corruption Measurement
Violations of integrity, fraud, and corruption result in reduced quality, affordability and availability of public services.
There is a presistent need to proactively and systematically identify, precisely and comprehensively measure, and effectively mitigate corruption.
Big Data methods allow researchers and policy analysts to used administrative data a to develop a granular, scalable, and actionable corruption indicators.
Competition and Corruption
The aim of institutionalised corruption is to steer the contract to the favoured bidder without detection in a recurrent and organised fashion.
Corruption in public procurement requires at least two violations of principles of fair distribution of public resources:
- avoiding competition, by for example using unjustified sole-sourcing or direct contract awards;
- favouring a particular bidder, by for instance tailoring specifications, or sharing inside information
Public Procurement Data
Public procurement data sets are structured collections of data that capture the details of contracts awarded by government agencies or departments to private entities.
These data sets are designed to ensure transparency, accountability, and efficiency in the use of public funds. Similarly, procurement data is often used to measure corruption risks across various sectors (Fazekas and Hernández Sánchez 2021; Czibik et al. 2021).
Procurement Data Example
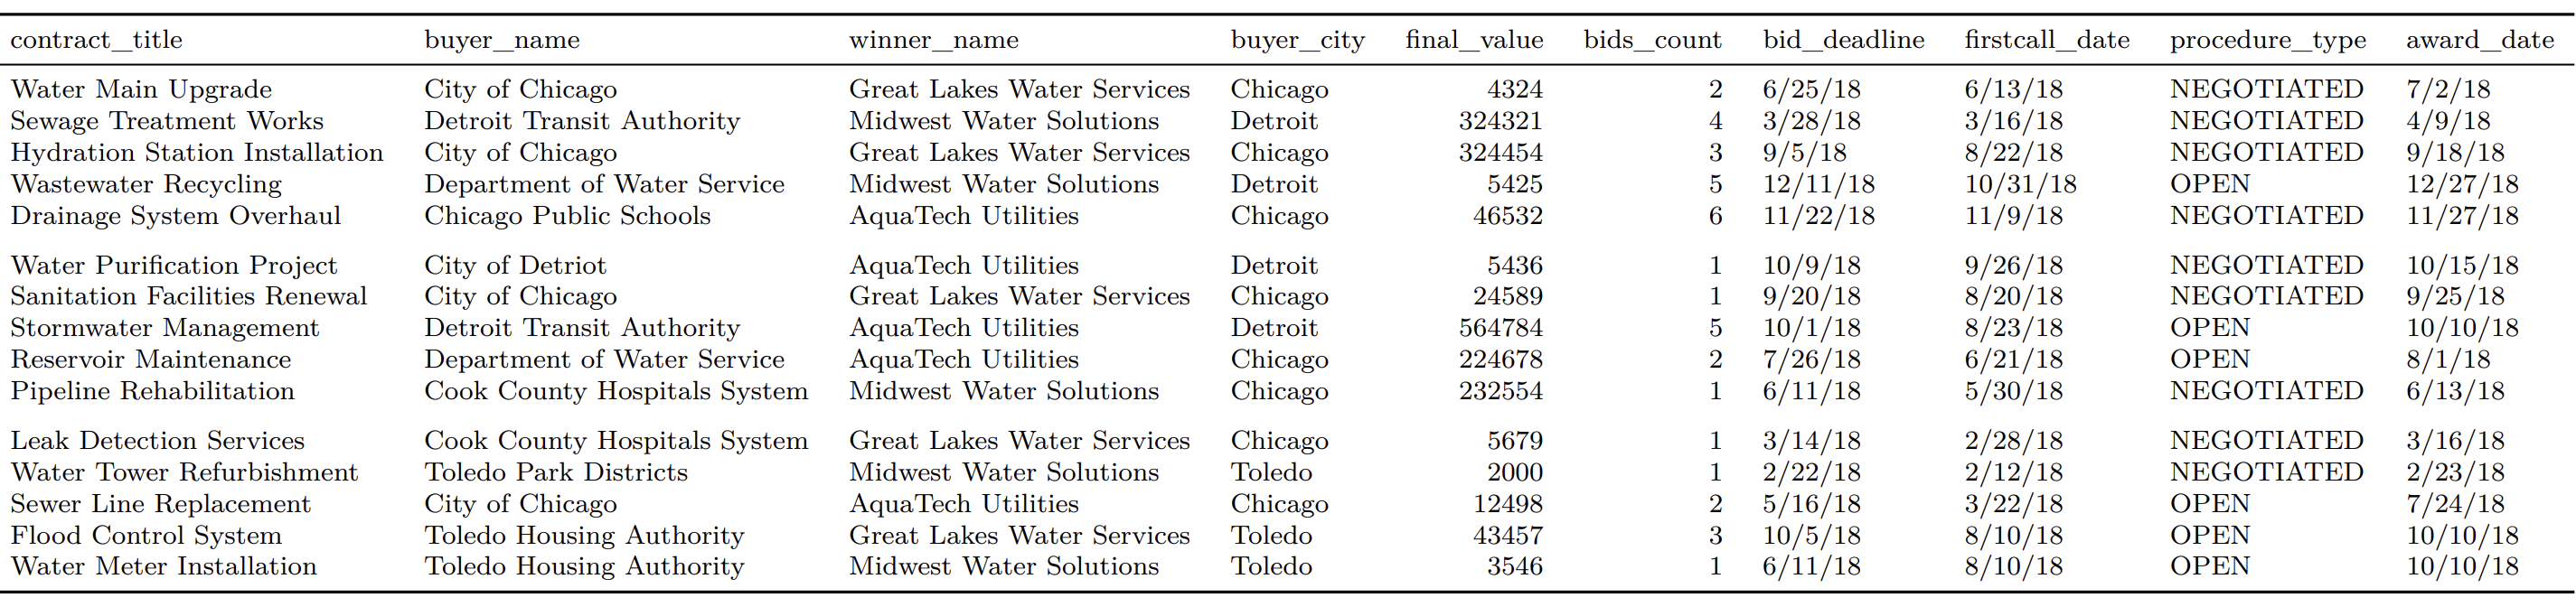
Case Study: WIRI
Water and Sanitation Integrity Risk Indicator
The Water Integrity Risk Index (WIRI) is made up of procurement data indicators as well as survey-based measures of direct corruption experience to identify and assess integrity risks in the urban W&S sector.
It is a is micro-level analysis, narrowly focuses on the W&S sector at the level of settlements and is both transparent and replicable.
WIRI Design
We identify three main pillars of integrity in the W&S sector:
- Public investment projects (e.g. building new pipelines or drainage),
- Recurrent spending supporting ongoing operations (e.g. paying salaries, purchasing computers), which is addressed as operations in this work; and
- Client-utility interactions (e.g. paying utility bills).
WIRI Methodology
Given that integrity is a latent variable, we must rely on proxy indicators which can, in conjunction, reveal integrity risks. We calculate the composite WIRI with the following steps:
- Standardize each component indicator of integrity-risk so that they can be directly compared (higher values imply higher integrity).
- Calculate the weight of each component indicator (5 in total, categorized into 3 pillars) by the amount of data points available for the timeseries in a global version of the WIRI. Fewer available data points in a component lead to a decrease its pillar weight on the index.
- We calculate the weighted mean of each indicator to derive the composite WIRI score based on the data available.
Public Procurement Indicators
We assign each public procurement contract to one of the 3 pillars using product codes (e.g. CPV) or descriptions.
The public procurement indicator is a composite score of five elementary risk metrics:
- Decision Period
- Call for Tenders
- Advertisement Period
- Procedure Type
- Single Bidding
Survey Indicators
We employ survey data to construct the indicator on direct bribery experiences in the W&S sector.
For each of the available survey, we calculate the rate of bribery by dividing the number of respondents who admitted bribery over the total number of respondents who required or requested a W&S service in a settlement.
For example, in Kenya, we rely on the Afro-barometer, collecting positive responses from a representative sample of the population of settlements in the country who admit to bribing to obtain water services.
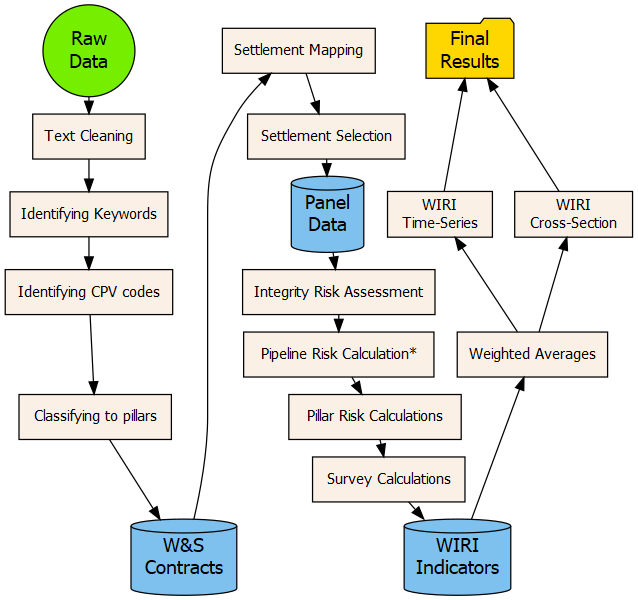
WIRI Workflow
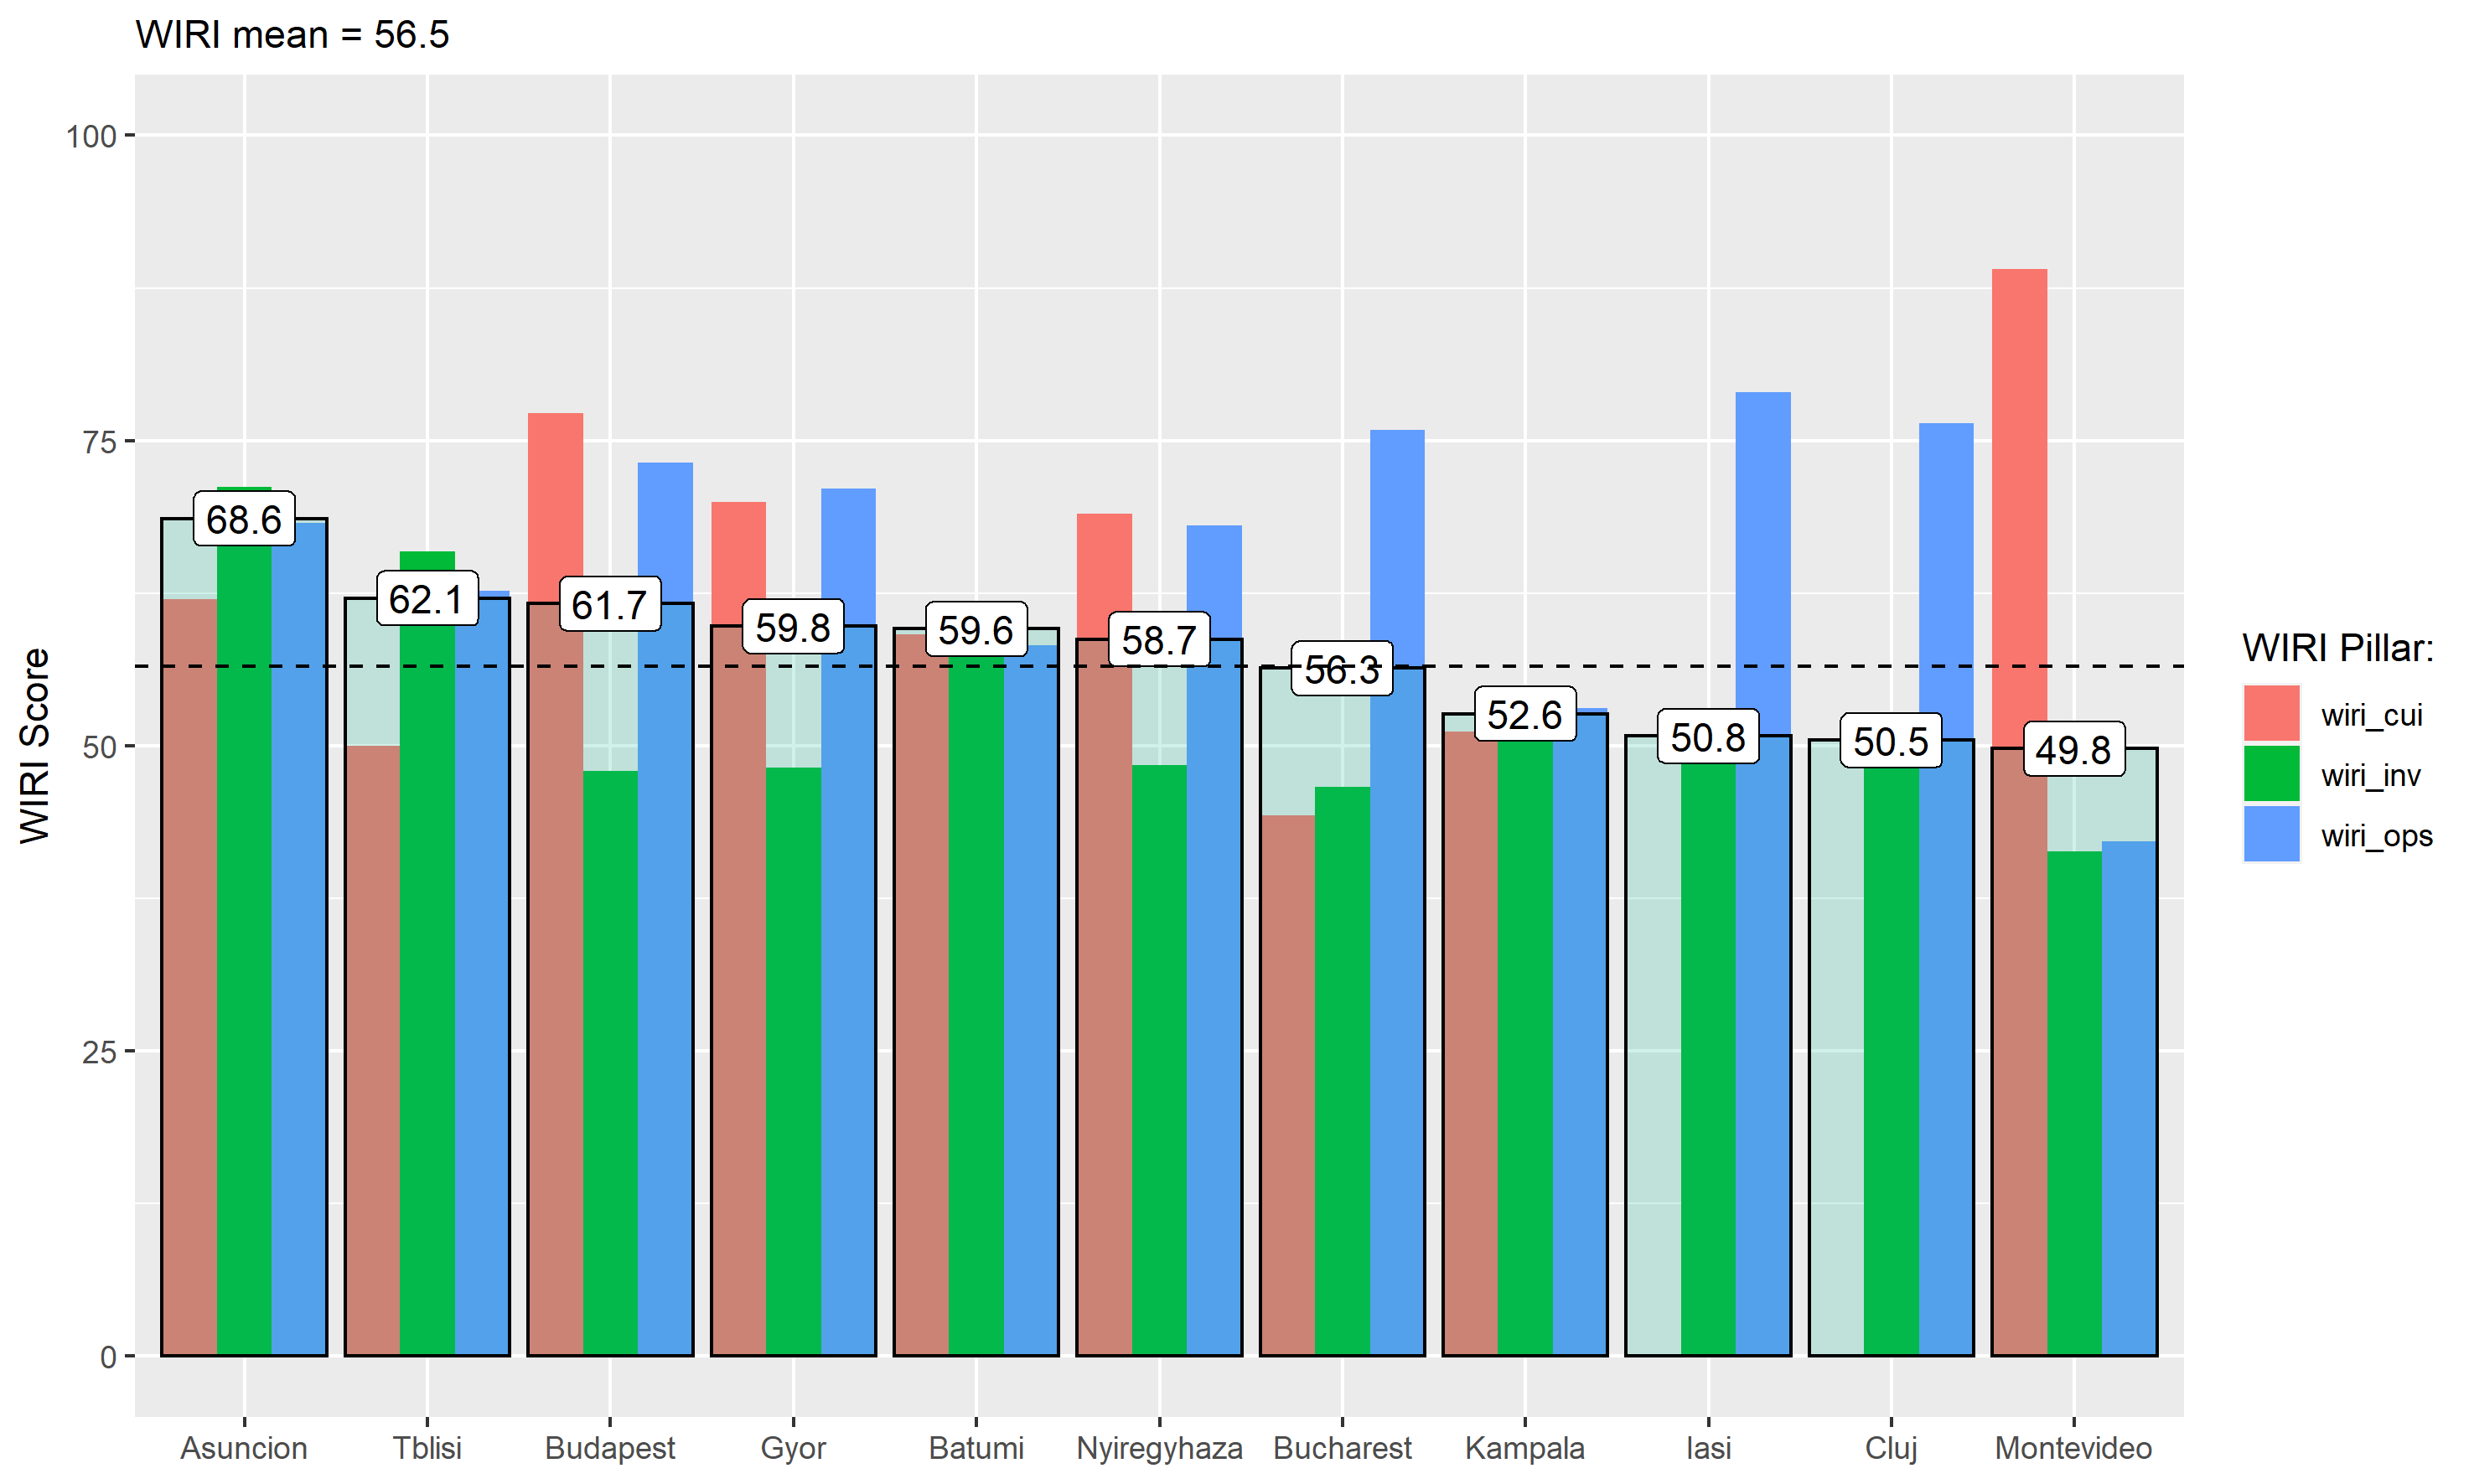
WIRI Results (Cross Section)
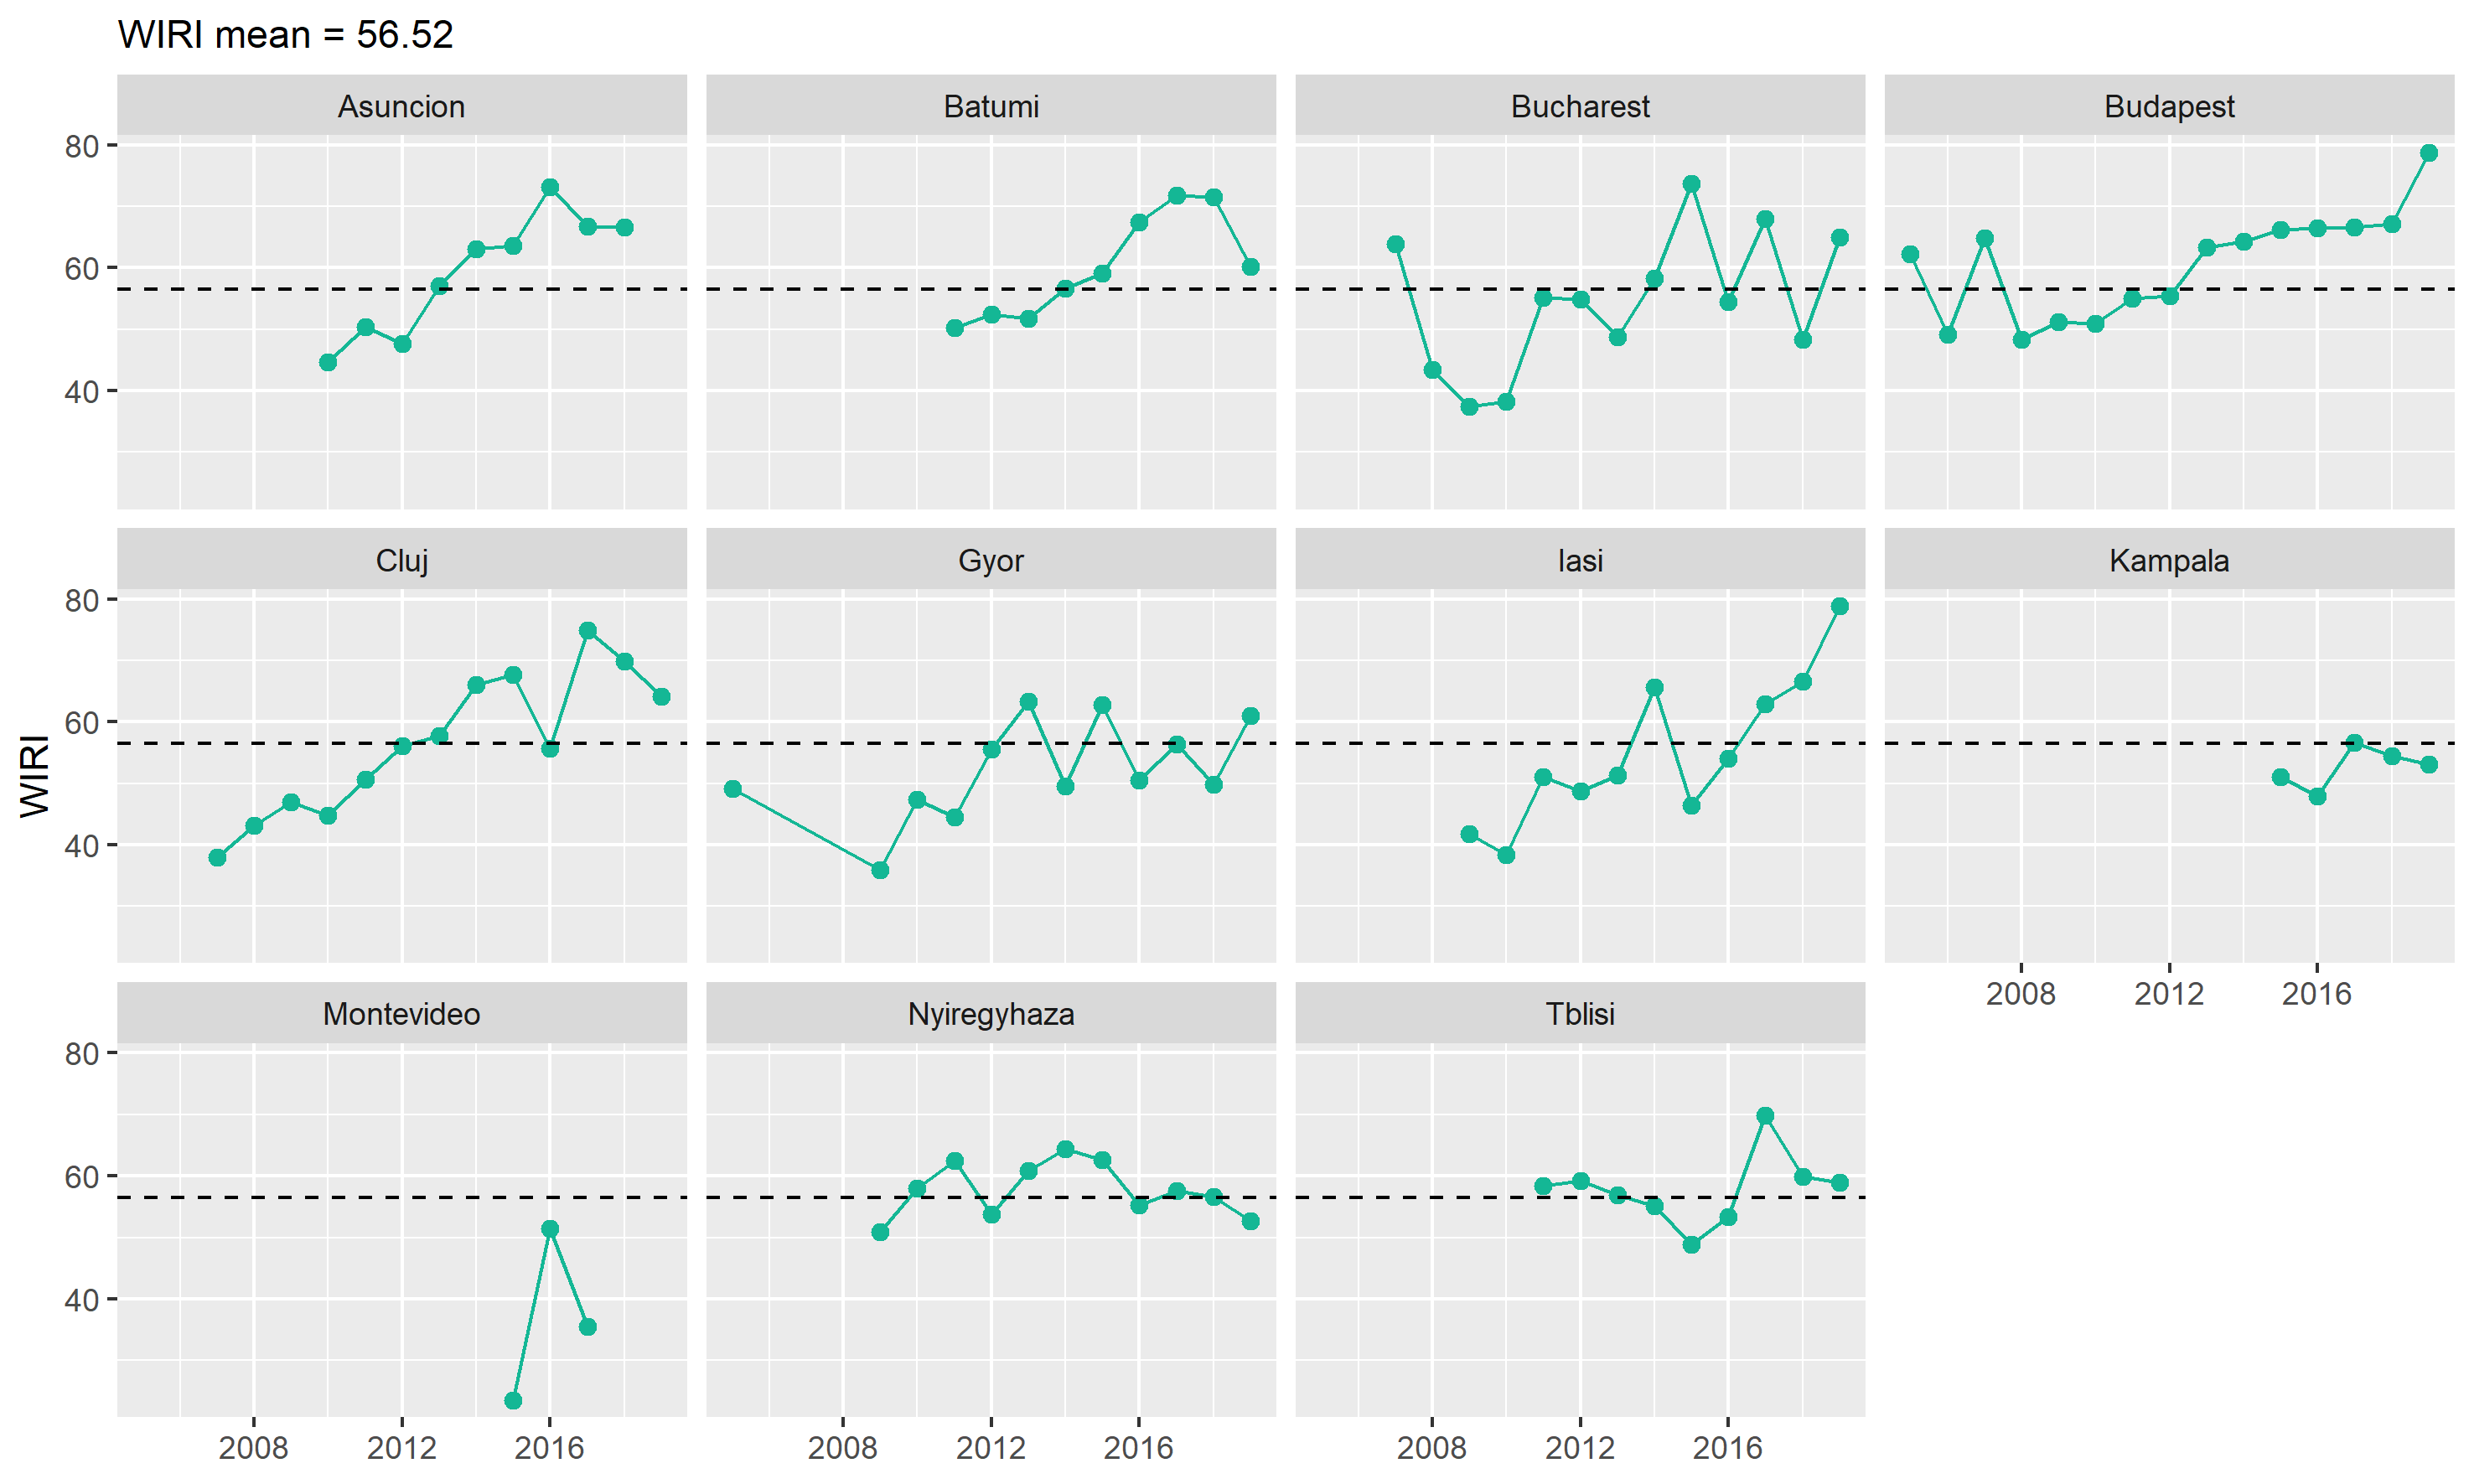
WIRI Results (Timeseries)
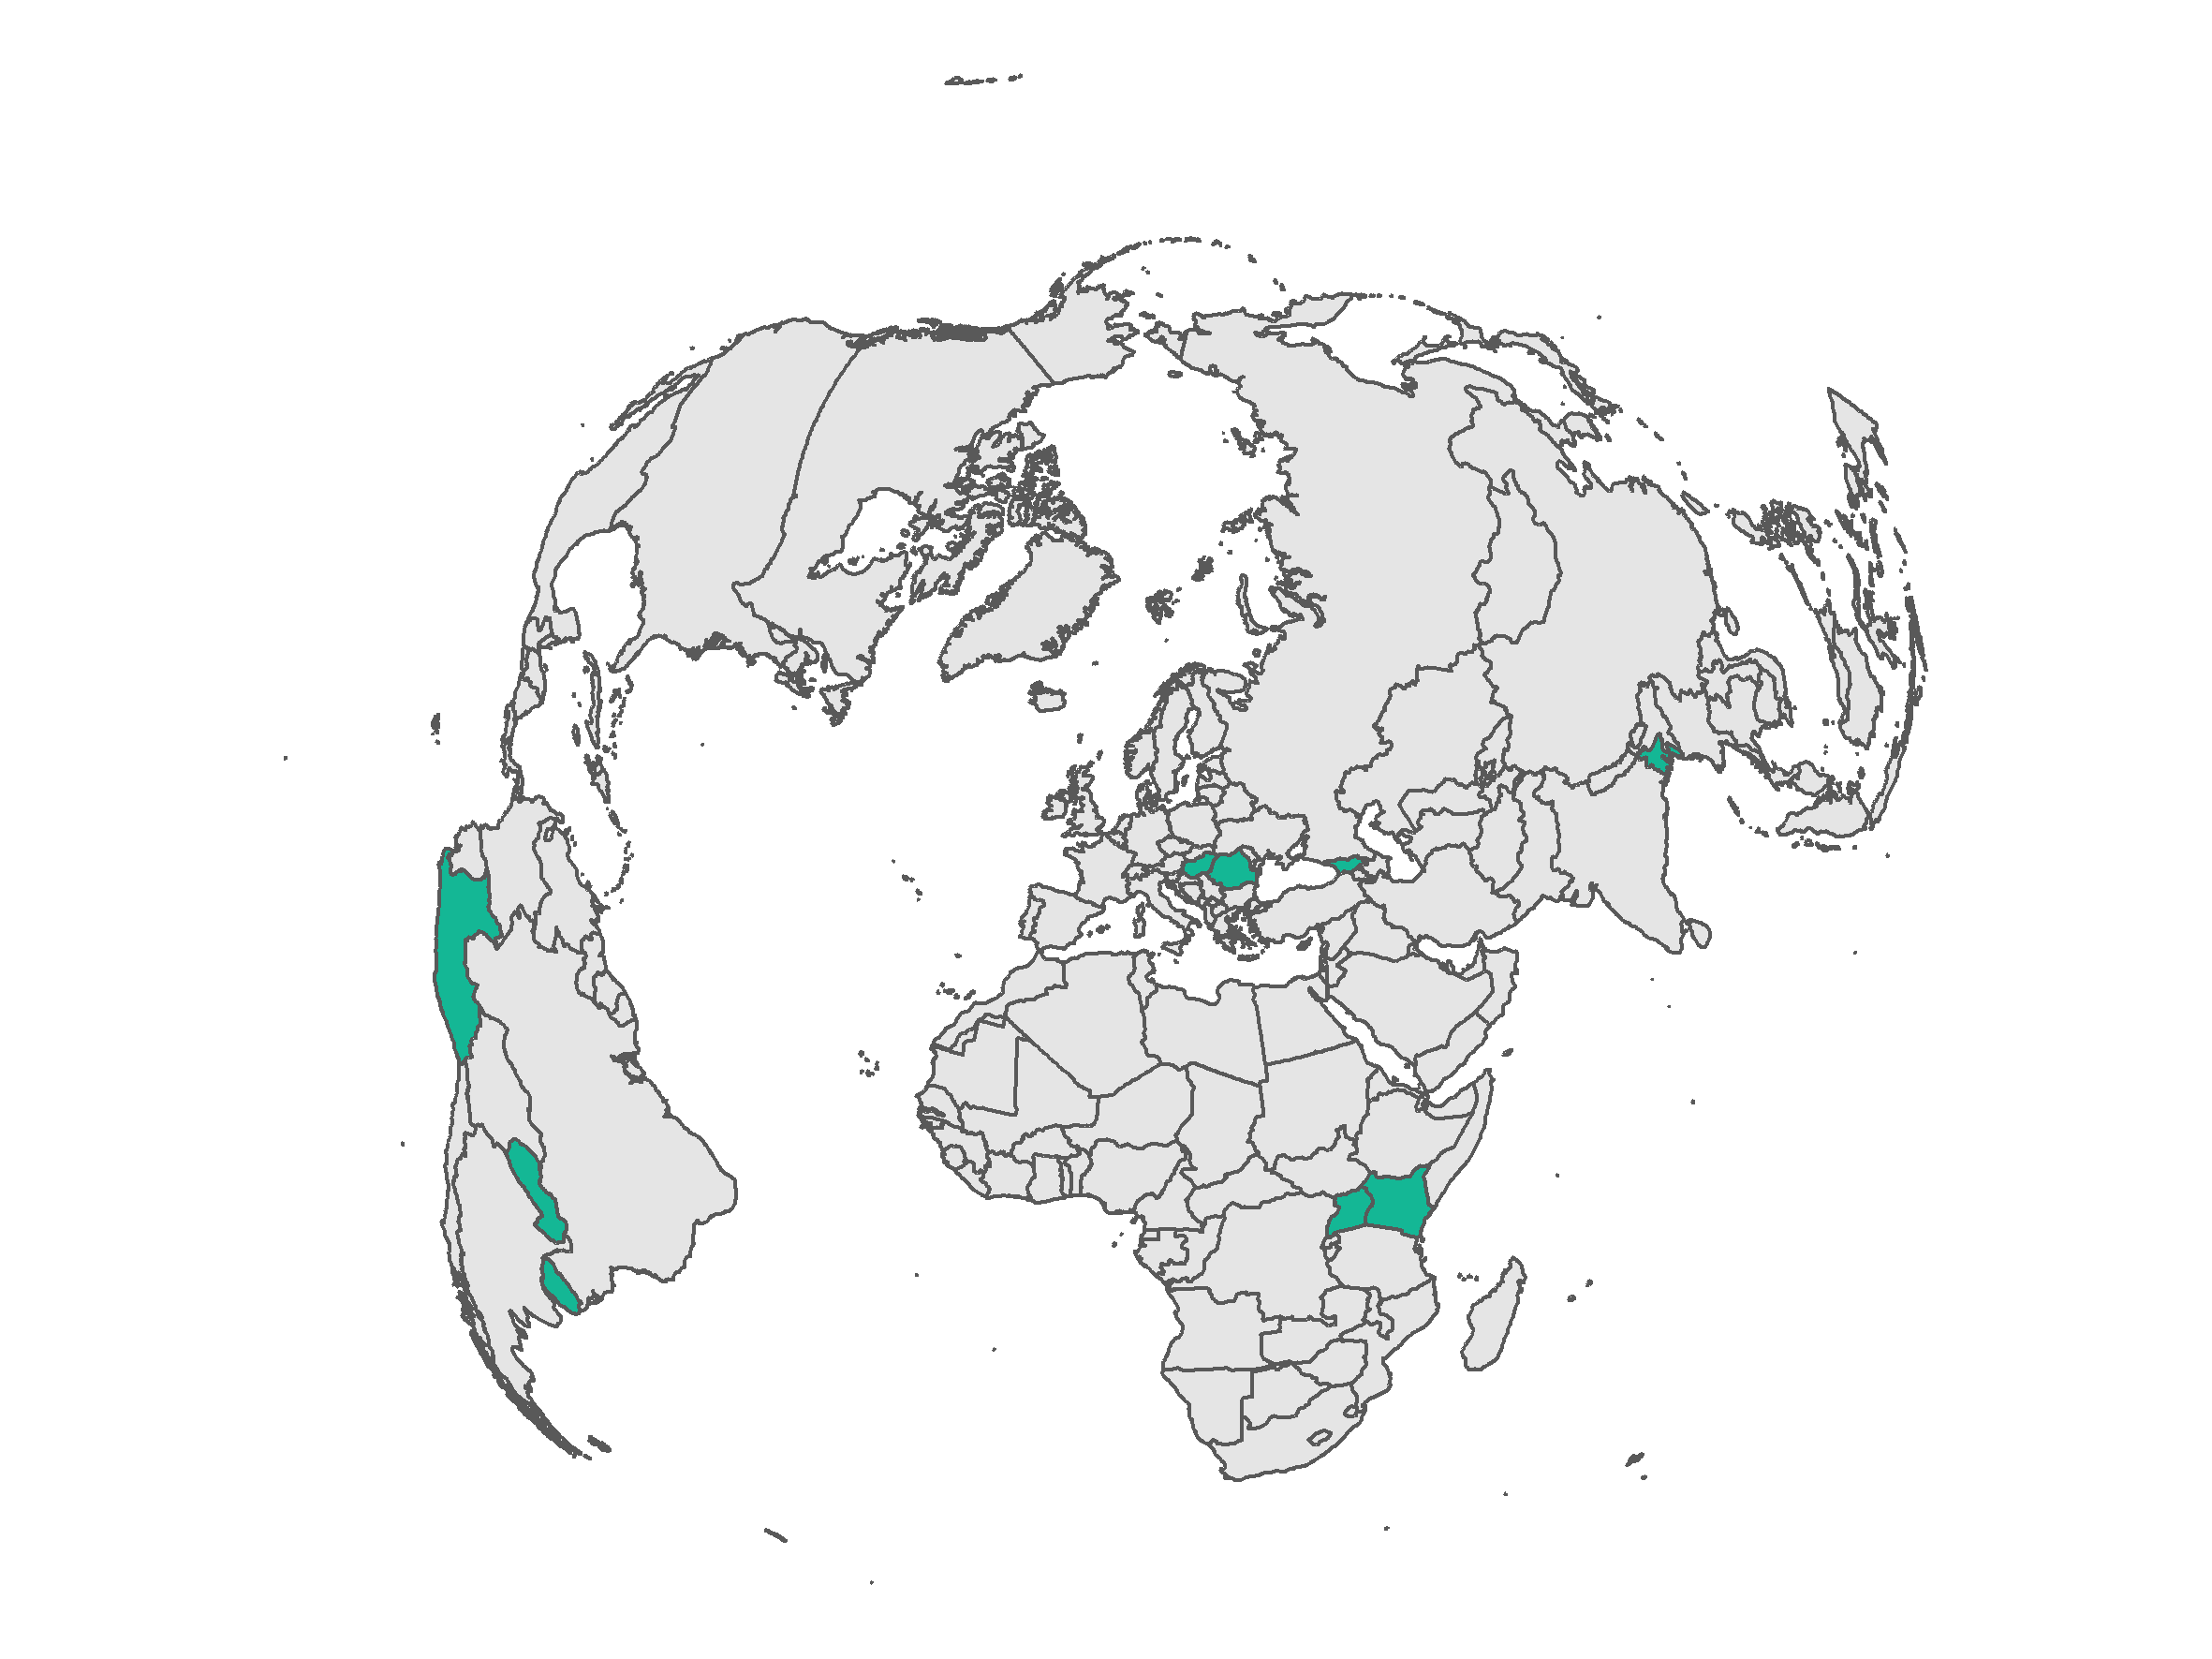
WIRI Global Coverage
The Interactive Tool
Thank you for your attention!
References
![]()